Research entry
Anomaly Detection in SDSS Stellar Spectra
Active · March 2026
Seven anomaly detectors — from Isolation Forest to a conditional normalizing flow — running on public SDSS DR18 stellar spectra. Includes a physics-motivated PBH candidate screening pipeline, semi-synthetic evaluation harness, and a Streamlit dashboard. Scales to 50K+ spectra.
Overview
The Sloan Digital Sky Survey (SDSS) has published spectra for millions of stars. Most are unremarkable. A small fraction are genuinely strange — composite systems, rare subtypes, data artefacts, or possibly something that doesn’t fit any known category.
This project builds a pipeline to find them. Seven anomaly detectors score each spectrum independently, a rank aggregation layer identifies consensus outliers, and a separate physics-motivated screening layer flags candidates with spectral signatures consistent with primordial black hole (PBH) interactions. Everything is exposed through a Streamlit dashboard with a human review labeling workflow.
The goal is not to claim discoveries. The goal is to build the tooling to know what “anomalous” actually means across 50,000 spectra, and to practice building real evaluation harnesses for unsupervised learning — a setting where ground truth is expensive and conformal guarantees matter.
Pipeline Architecture
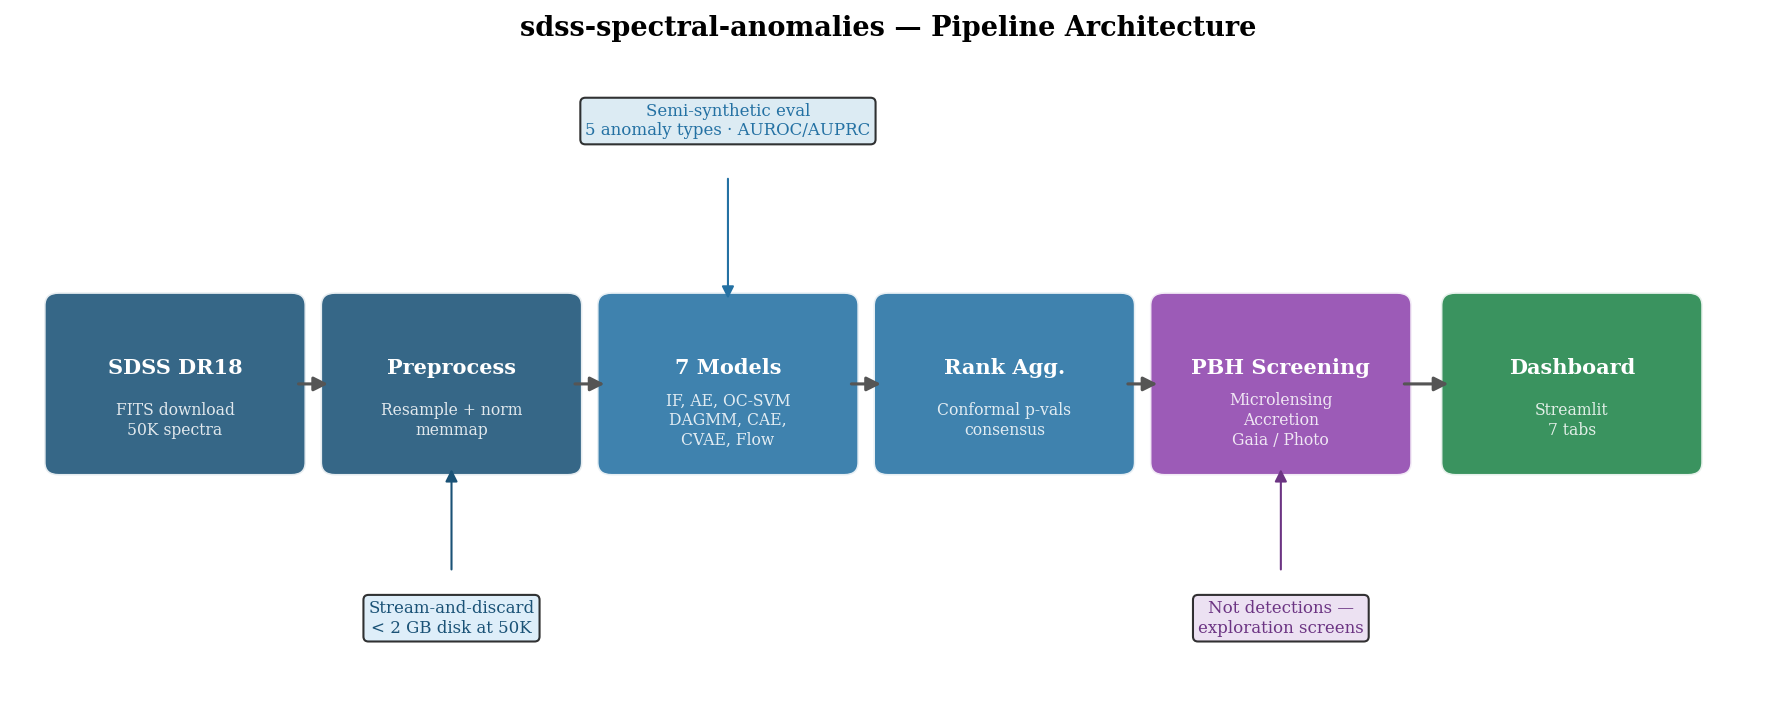
Data flows through six stages:
-
SDSS DR18 download — FITS files queried by S/N ratio and object type, downloaded in parallel batches of 500. A stream-and-discard architecture preprocesses each batch immediately into a memory-mapped float32 array and deletes the raw FITS, keeping disk usage under 2 GB for 50K spectra. Checkpoint/resume via JSON means a crashed pipeline picks up where it left off.
-
Preprocessing — Spectra are resampled onto a common wavelength grid, normalised, and written to a memmap. A 44-dimensional line feature vector is also extracted per spectrum (11 spectral lines × 4 features: equivalent width, local depth, asymmetry, derivative variance).
-
7 anomaly detectors — Models range from classical to generative:
Model Type Score PCA + Isolation Forest Classical Isolation score Convolutional Autoencoder Deep Reconstruction error One-Class SVM Classical (subsampled) Decision function DAGMM Generative Energy score Conditional Autoencoder Deep, metadata-conditioned Reconstruction error given stellar params Conditional VAE Variational, metadata-conditioned Negative ELBO Conditional MAF Normalizing flow Negative log-likelihood The conditional models ask “is this spectrum strange for a star with these parameters?” rather than just “is this spectrum rare in the population?” The MAF provides true log-likelihood; the CVAE provides an ELBO lower bound. Both are calibrated into conformal p-values with finite-sample guarantees via split conformal calibration.
-
Rank aggregation — Scores are merged into
comparison.parquet. The top anomalies by combined rank are flagged for dashboard review; candidates agreed on by 3+ models are surfaced separately. -
PBH screening — A physics-motivated layer runs on top of the unsupervised scores (see below).
-
Dashboard — Streamlit app with 7 tabs: Anomaly Browser, Model Comparison, PCA Explorer, Stability, Semi-Synthetic Evaluation, Focused Review, and PBH Candidates.
Model Evaluation
Evaluation uses a semi-synthetic harness: clean spectra with five types of injected anomalies (emission line insertion, line broadening, continuum tilt, wavelength shift, missing band segment). Precision@k, recall@k, AUROC, and AUPRC are computed per model.
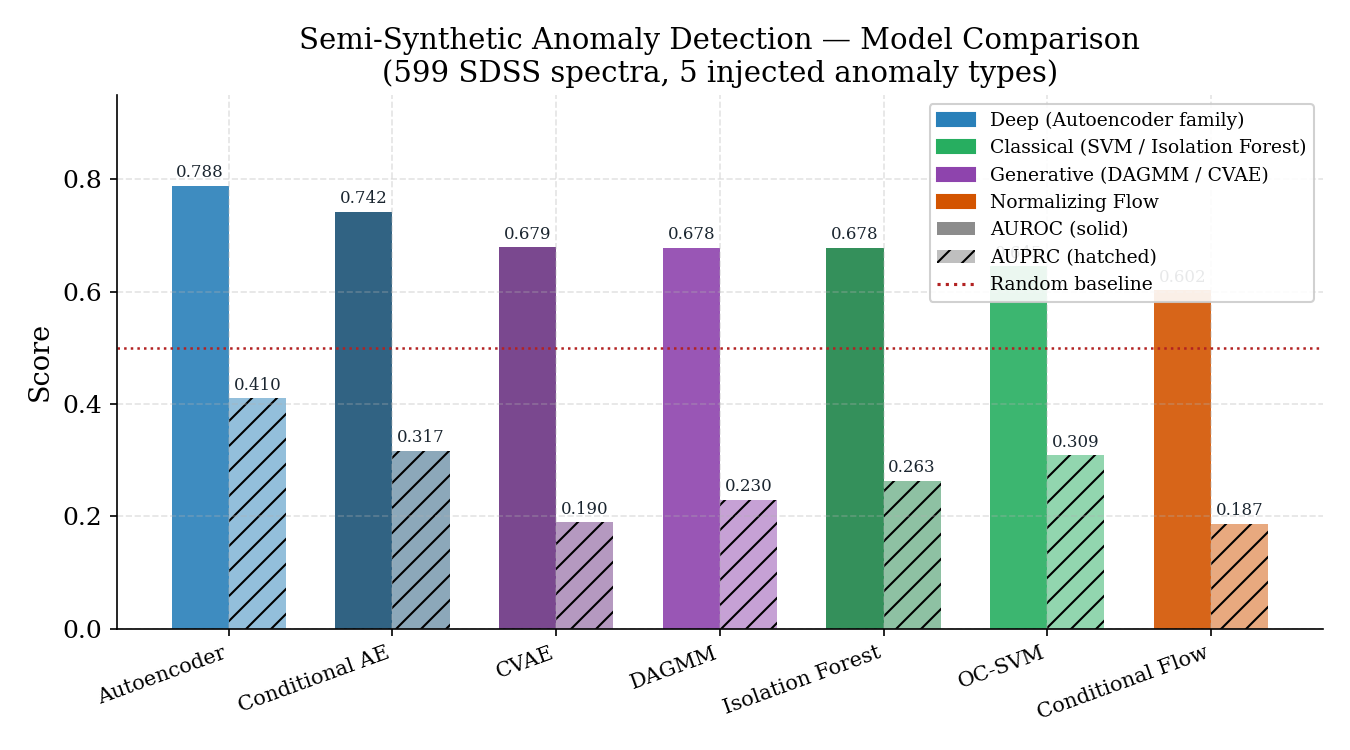
The convolutional autoencoder leads on both metrics (AUROC=0.788, AUPRC=0.410). The conditional autoencoder follows (AUROC=0.742), suggesting that metadata conditioning helps but the reconstruction bottleneck is the stronger signal. The normalizing flow has the lowest AUROC despite providing true likelihood — likely because the flow’s training objective is dominated by normal spectra, making the likelihood surface poorly calibrated for rare anomaly types.
The AUPRC gap between AUROC and AUPRC is significant across all models, reflecting the class imbalance in real anomaly detection: even good discriminators struggle to maintain precision at the top of the ranking list.
PBH Candidate Screening
The PBH layer is explicitly exploratory. Primordial black holes — if they exist at stellar masses — would be expected to leave spectral signatures through gravitational microlensing, accretion disk formation, or astrometric perturbation of a stellar companion. None of these signatures are unique to PBHs; many mundane phenomena produce similar features. The goal is to build a toolchain that could flag candidates worth follow-up, not to confirm detections.
Five feature extractors run on every spectrum:
- Microlensing score — continuum-to-line flux ratio deviations from spectral-class expectations, plus achromatic residual analysis
- Accretion score — unexpected emission line detection, blue/UV excess vs Planck shape, power-law continuum fitting
- Line asymmetry — skewness, kurtosis, and blue/red equivalent width ratio for 7 stellar absorption lines; sensitive to differential limb magnification
- Multi-epoch variability — groups repeat SDSS observations by sky position, scores achromatic vs chromatic flux changes
- Gaia astrometry / SDSS photometry cross-match — RUWE, excess noise, IPD harmonic amplitude, and dereddened color analysis for blue excess
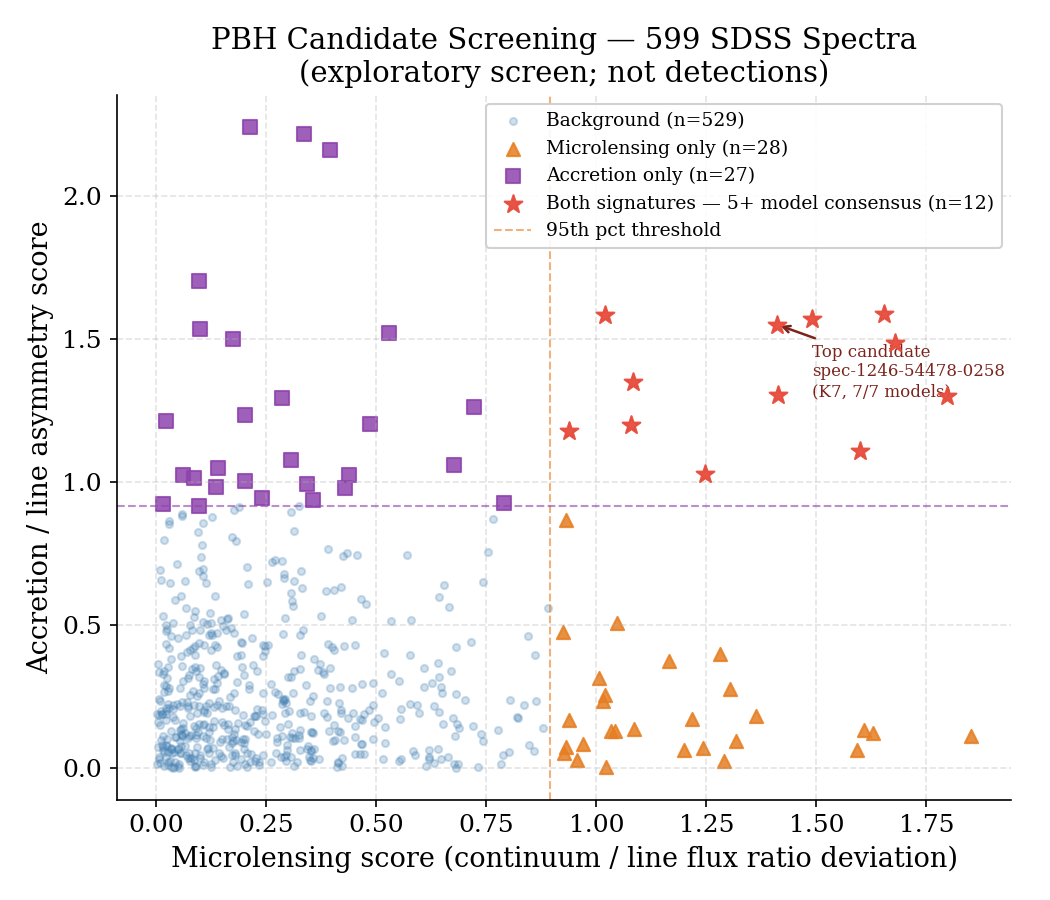
At the 95th percentile threshold on 599 spectra: 30 microlensing candidates, 30 accretion candidates, 10 overlapping both with 5+ unsupervised model consensus. The top candidate (spec-1246-54478-0258, K7 dwarf) scores 1.41 on microlensing, 1.55 on line asymmetry, and reaches 7/7 model agreement on the unsupervised anomaly ranking. Accretion candidates are dominated by white dwarf classified objects with mismatched effective temperatures — most likely composite or binary systems rather than anything exotic.
Engineering Notes
Scaling to 50K spectra — The stream-and-discard download architecture was the main engineering challenge. SDSS FITS files average ~2 MB each; 50K spectra is 100 GB of raw data. The pipeline downloads in batches of 500, preprocesses into the memmap immediately, and deletes raw FITS. The OC-SVM is subsampled at max 5,000 training examples to avoid an O(N²) kernel matrix; PCA and scaler still fit on the full population.
Conformal calibration — Raw anomaly scores have no calibrated meaning across models. Split conformal calibration converts each model’s scores into p-values with a finite-sample guarantee: a spectrum with p-value < 0.05 is flagged as anomalous at a controlled false positive rate on the calibration set. This makes cross-model comparison meaningful and gives the human review workflow a principled prioritisation signal.
175 tests — The test suite covers all models, feature extractors, conformal calibration, evaluation metrics, and the review labeling workflow. Integration tests run a full synthetic pipeline end-to-end.
Status
Active. The 50K run is pending (downloads complete, model training to resume). The PBH Gaia cross-match was blocked by ESA archive degradation and will be retried. The photometric cross-match is pending an SDSS CasJobs query for the full 50K footprint.
Next steps: complete the 50K training run, produce AUROC/AUPRC curves at scale, and run the full PBH screening suite on the extended candidate list.